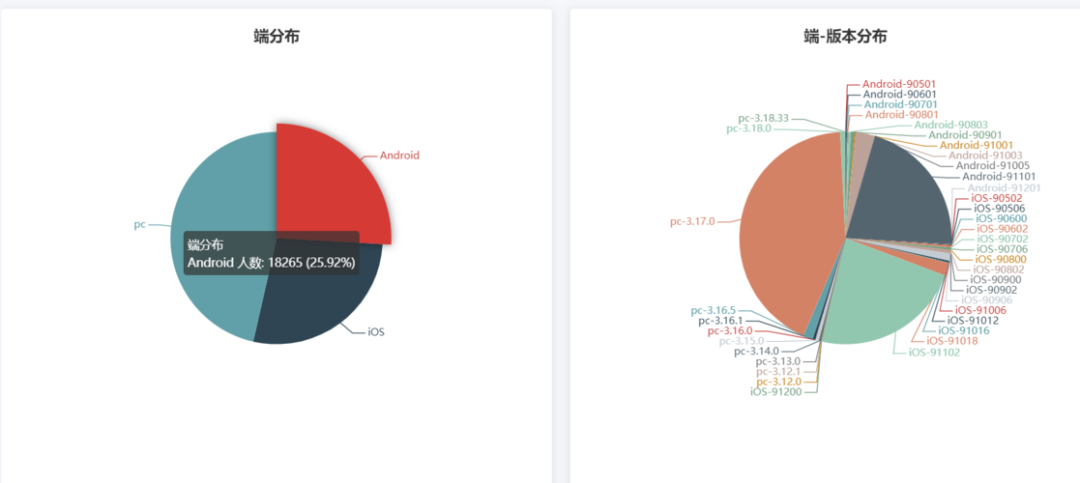
1. vue2项目中,使用echart的饼图
在Vue 2项目中使用ECharts的饼图,你需要遵循以下步骤:
1.1. 安装 ECharts
首先确保你已经在项目中安装了ECharts。你可以通过npm或yarn来安装它。
npm install echarts --save
或者如果你更喜欢使用yarn:
yarn add echarts
1.2. 创建一个 Vue 组件
创建一个新的Vue组件(比如PieChart.vue),然后在这个组件里引入并配置ECharts。
<template>
  <div ref="pieChart" class="pie-chart"></div>
</template>

<script>
import * as echarts from'echarts';

exportdefault {
name: 'PieChart',
mounted() {
    this.initChart();
  },
methods: {
    initChart() {
      // 基于准备好的dom,初始化echarts实例
      const chart = echarts.init(this.$refs.pieChart);

      // 指定图表的配置项和数据
      const option = {
        title: {
          text: '某站点用户访问来源',
          subtext: '纯属虚构',
          left: 'center'
        },
        tooltip: {
          trigger: 'item'
        },
        legend: {
          orient: 'vertical',
          left: 'left'
        },
        series: [
          {
            name: '访问来源',
            type: 'pie',
            radius: '50%',
            data: [
              { value: 1048, name: '搜索引擎' },
              { value: 735, name: '直接访问' },
              { value: 580, name: '邮件营销' },
              { value: 484, name: '联盟广告' },
              { value: 300, name: '视频广告' }
            ],
            emphasis: {
              itemStyle: {
                shadowBlur: 10,
                shadowOffsetX: 0,
                shadowColor: 'rgba(0, 0, 0, 0.5)'
              }
            }
          }
        ]
      };

      // 使用刚指定的配置项和数据显示图表。
      chart.setOption(option);
    }
  }
};
</script>

<style scoped>
.pie-chart {
  width: 600px;
  height: 400px;
}
</style>
1.3. 在应用中使用这个组件
确保你的新组件可以在应用程序中的适当位置使用。例如,在App.vue中引入并使用PieChart组件:
<template>
  <div id="app">
    <PieChart />
  </div>
</template>

<script>
import PieChart from './components/PieChart.vue';

export default {
  name: 'App',
  components: {
    PieChart
  }
};
</script>
1.4. 调整样式
根据需要调整.pie-chart类的宽度和高度以适应你的布局需求。
1.5. 运行项目
确保一切都设置正确后,运行你的Vue项目,你应该能看到包含饼图的新页面。


